This page was generated by nbsphinx from docs/notebooks/transform/lapd_xy_droop_correction.ipynb.
Demo of LaPDXYDroopCorrect
[1]:
%matplotlib inline
[2]:
import numpy as np
import matplotlib.pyplot as plt
import sys

plt.rcParams["figure.figsize"] = [10.5, 0.56 * 10.5]
[3]:
try:
    from bapsf_motion.transform import LaPDXYDroopCorrect
except ModuleNotFoundError:
    from pathlib import Path

    HERE = Path().cwd()
    BAPSF_MOTION = (HERE / ".." / ".." / ".." ).resolve()
    sys.path.append(str(BAPSF_MOTION))

    from bapsf_motion.transform import LaPDXYDroopCorrect
Initialize our droop correct class LaPDXYDroopCorrect.
[4]:
dc = LaPDXYDroopCorrect(
    ("x", "y"),
    pivot_to_feedthru=21.6,
)
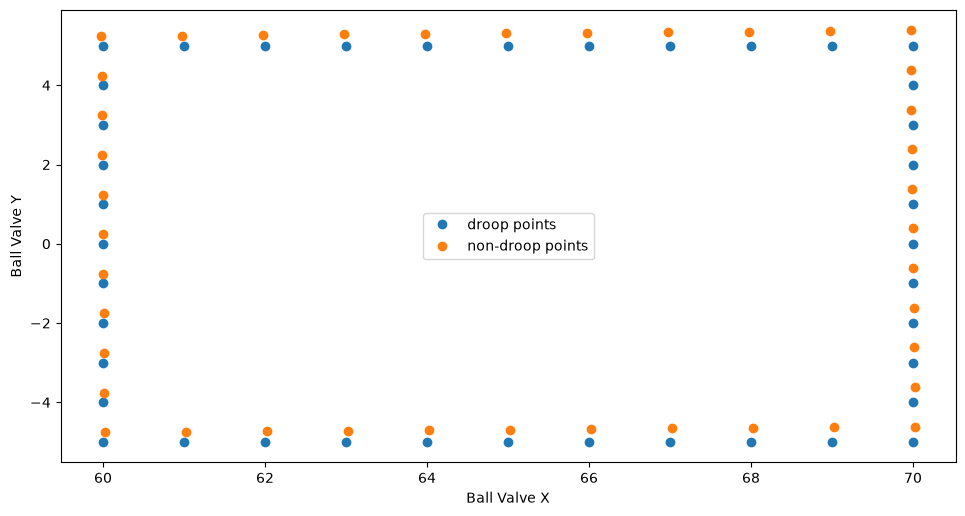
Generate some sample points. We will consider these as the end locations of a drooping probe shaft with respect to the LaPD ball valve.
[5]:
pivot_to_center = 65

points = np.zeros((40, 2))
points[0:10, 0] = pivot_to_center - np.linspace(-5, 5, num=10, endpoint=False)
points[0:10, 1] = 5 * np.ones(10)
points[10:20, 0] = pivot_to_center -  5 * np.ones(10)
points[10:20, 1] = np.linspace(5, -5, num=10, endpoint=False)
points[20:30, 0] = pivot_to_center - np.linspace(5, -5, num=10, endpoint=False)
points[20:30, 1] = -5 * np.ones(10)
points[30:40, 0] = pivot_to_center - -5 * np.ones(10)
points[30:40, 1] = np.linspace(-5, 5, num=10, endpoint=False)

points;
Let’s calculate the corresponding non-droop points ndroop_points and back again droop_points to see the correction returns to points.
[6]:
nondroop_points = dc(points, to_points="non-droop")
droop_points = dc(nondroop_points, to_points="droop")

np.allclose(droop_points, points)
[6]:
True
In reality points and droop_points are not exactly equal since the non-droop direction and to be determine through an interactive computation. Only the non-droop to droop correction has a fitted polynomial.
[7]:
(droop_points - points)
[7]:
array([[1.76058279e-10, 2.60615529e-10],
       [1.63424829e-10, 2.57820432e-10],
       [1.51473500e-10, 2.54268606e-10],
       [1.40175871e-10, 2.50051535e-10],
       [1.29517730e-10, 2.45253595e-10],
       [1.19456445e-10, 2.39956499e-10],
       [1.10006226e-10, 2.34229525e-10],
       [1.01117337e-10, 2.28141950e-10],
       [9.27826704e-11, 2.21755947e-10],
       [8.49667003e-11, 2.15127471e-10],
       [7.76552156e-11, 2.08308037e-10],
       [8.06323897e-11, 2.05090167e-10],
       [8.35811420e-11, 2.01928252e-10],
       [8.65441052e-11, 1.98818295e-10],
       [8.94928576e-11, 1.95755856e-10],
       [9.24345045e-11, 1.92736965e-10],
       [9.53832568e-11, 1.89756877e-10],
       [9.83249038e-11, 1.86811011e-10],
       [1.01259445e-10, 1.83895565e-10],
       [1.04201092e-10, 1.81006321e-10],
       [1.07149845e-10, 1.78137505e-10],
       [1.14631860e-10, 1.83149496e-10],
       [1.22547306e-10, 1.87896809e-10],
       [1.30910394e-10, 1.92328820e-10],
       [1.39721124e-10, 1.96387795e-10],
       [1.49015023e-10, 2.00013339e-10],
       [1.58792091e-10, 2.03138839e-10],
       [1.69080749e-10, 2.05695905e-10],
       [1.79880999e-10, 2.07603712e-10],
       [1.91178628e-10, 2.08781437e-10],
       [2.03016270e-10, 2.09142037e-10],
       [2.00301997e-10, 2.14242846e-10],
       [1.97587724e-10, 2.19337881e-10],
       [1.94887662e-10, 2.24434027e-10],
       [1.92173388e-10, 2.29538277e-10],
       [1.89473326e-10, 2.34654407e-10],
       [1.86773264e-10, 2.39787967e-10],
       [1.84087412e-10, 2.44945397e-10],
       [1.81387350e-10, 2.50131915e-10],
       [1.78715709e-10, 2.55353072e-10]])
Plot
[8]:
figwidth, figheight = plt.rcParams["figure.figsize"]
figwidth = 1.1 * figwidth
figheight = 1.0 * figheight
fig, axs = plt.subplots(1, 1, figsize=[figwidth, figheight])

axs.set_xlabel("Ball Valve X")
axs.set_ylabel("Ball Valve Y")

axs.plot(points[..., 0], points[..., 1], 'o', label="droop points")
axs.plot(nondroop_points[..., 0], nondroop_points[..., 1], 'o', label="non-droop points")
axs.legend();
[ ]: